How does Solar work?
Learn how Solar Energy works with our easy-to-understand explanation below.
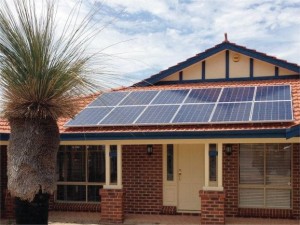
In Perth, a modern grid-connected solar energy system typically includes advanced components for efficient energy conversion and management.
Solar cells work by converting visible light into electricity through a process called the photovoltaic effect. Photons in visible light hit the solar cell and are absorbed by the semiconducting material (which in most cases is silicon), creating an electron hole, which another electron must fill. This causes movement in the electrons thus creating a flow of electricity, also called direct current (DC).
1. High-Efficiency Panels: Utilising the latest photovoltaic technology, these panels have improved energy conversion rates, ensuring more electricity is generated from the same amount of sunlight.
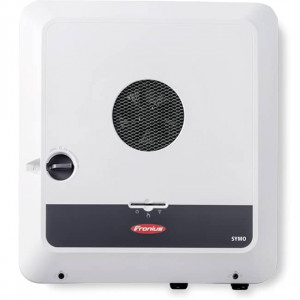
2. Smart Solar Inverter: This device not only converts DC to the standard 230V AC but also optimises energy production with real-time adjustments based on grid demands and solar intensity.
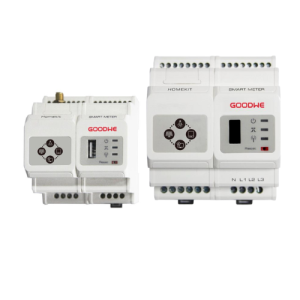
3. Integrated Switchboard & Smart Meter: The smart meter precisely tracks energy production and consumption, enabling dynamic energy management and potentially qualifying for feed-in tariff benefits. They can also dynamically and intelligently control loads of electric vehicle chargers which allows for smarter, more efficient charging.
4. Enhanced Electrical Grid Connection: With the integration of battery storage systems, excess energy can be stored for use during peak hours, reducing reliance on the grid and enhancing energy independence.
Recent developments in Perth’s solar energy landscape include the Waroona Renewable Energy Project, which has increased battery storage duration by 12%, allowing for extended energy availability. Additionally, the state government has outlined plans to significantly expand the South West Interconnected System (SWIS) to accommodate the growing demand for renewable energy. These advancements reflect Perth’s commitment to a sustainable energy future, leveraging cutting-edge technology to maximise energy utilisation.
Click here to learn more detailed explanation


Metering and System Performance for your home
Metering Requirements
In order to record the imported and exported energy your solar system produces a bi-directional meter is required in most states including WA. This Is called “Net” Metering. Other States require “Gross” metering which is basically two standard meters, one records export and the other imported energy.
After you have applied for the Renewable Energy Buyback Scheme from your Energy Provider, your Energy Provider will have determined whether they will need to change the meter at your property. They will send someone out to change the meter. Sometimes the meter will be changed without you being notified.
Please look for a small green “Import/Export” Sticker on your new or reprogrammed meter. This will confirm that it is ready for Grid connection of your new solar energy system.
System performance
The performance and output of your solar system is influenced by several factors – the directions the panels are facing, the angle and tilt of the panels, the geographic location of your house, the related climate conditions, objects that cause shading and the amount of dust and bird droppings on your panels.
Your solar system will be at its peak in summer, when the days are long and the weather is sunny. Whilst it will be at its low in winter, when the days are short and the weather is cloudy and rainy.
We provide prior to purchase, a full solar production estimate and seasonal system performance output graph.
The table below shows the average kilowatt hours (kWh) of energy that a 1 kW size solar system can generate per day in various parts of Australia. The calculated estimated performance of your system is based on your specific set up – panel direction, tilt, geographic location etc.
| Location | Best Month kWh per day |
Worst Month kWh per day |
Annual Average kWh per day |
|---|---|---|---|
| Perth | 5.40 | 2.93 | 4.40 |
| Brisbane | 4.61 | 3.34 | 4.04 |
| Canberra | 5.32 | 2.76 | 4.22 |
| Darwin | 5.11 | 3.54 | 4.47 |
| Hobart | 4.6 | 2.14 | 3.54 |
| Sydney | 4.83 | 2.82 | 3.94 |
| Melbourne | 4.59 | 2.22 | 3.58 |
| Adelaide | 5.72 | 2.51 | 4.25 |
| Alice Springs | 5.19 | 4.21 | 4.81 |
| Cairns | 4.44 | 3.18 | 3.86 |

